




The 5 drivers of customer satisfaction: product experience, service quality, communication, loyalty, and customer experience
The drivers of customer satisfaction largely determine how customers perceive an organization. Many ...
Verder lezen



In many organisations they live in two separate worlds. HR measures employee satisfaction, customer service or marketing measures customer satisfaction. Different department, different moment, different report. And the two rarely end up side by side on the table, even though research into the service-profit chain has shown for decades that they are linked.
That is a pity. Because anyone who puts both side by side sees something neither measurement shows on its own.
The employee at the counter, on the phone or on the building site is in contact with customers every day. They are the first to notice a customer becoming dissatisfied, often long before that customer says so in a survey or leaves. And a team that gets stuck in its own work is eventually noticed by the customer too: in waiting times, in mistakes, in a conversation that is just a little less friendly.
So employee experience and customer experience are not two separate topics. They are two sides of the same story.
The link between how employees experience their work and how customers experience the service has been researched for decades. In the 1980s, Schneider and Bowen showed in banks that the way employees rated the service in their branch was related to how customers rated that same branch.
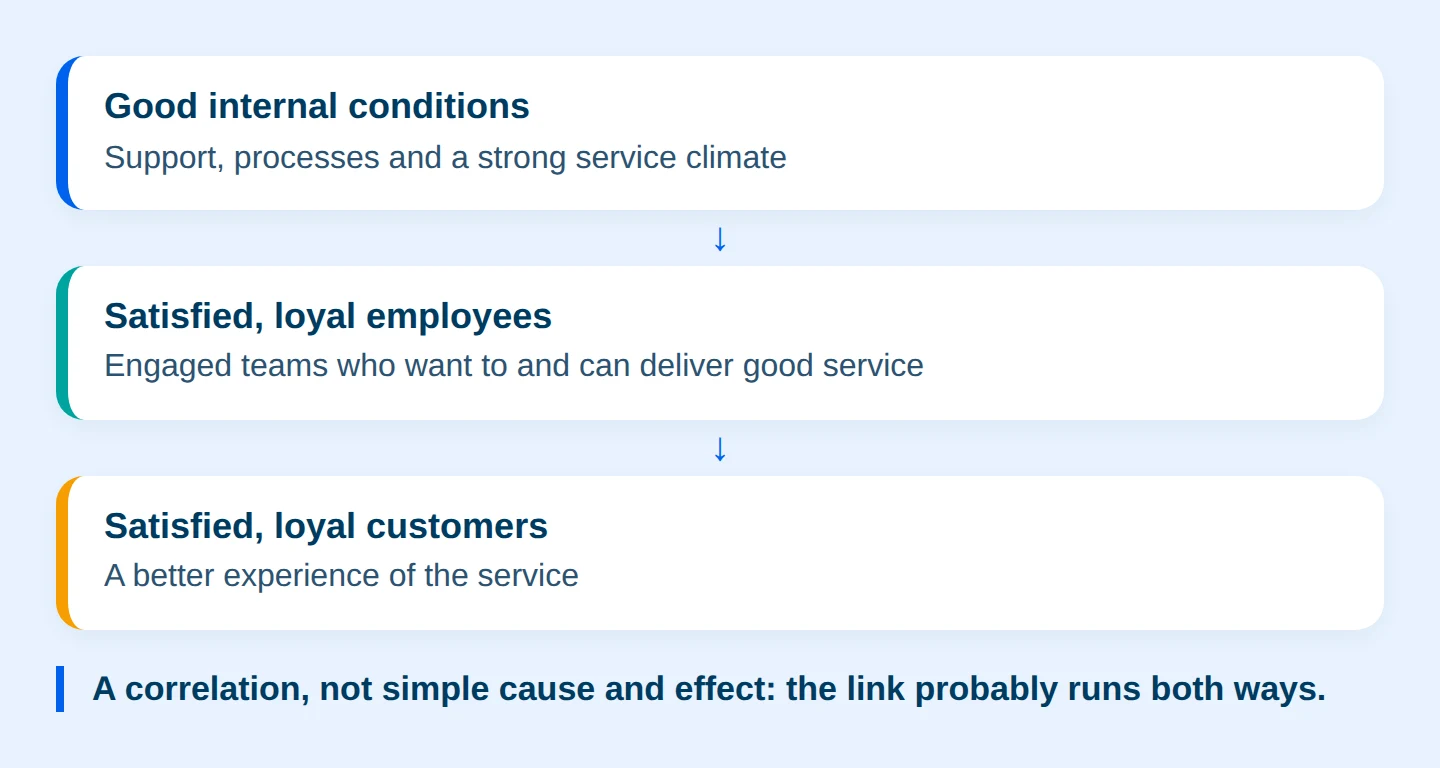
Later, Schneider, White and Paul showed that a strong service climate is related to the quality of service customers experience. A service climate is the shared sense in a team that good service really counts and is also supported. Heskett and colleagues described a similar relationship as the service-profit chain: a chain from good internal conditions, via satisfied and loyal employees, to satisfied and loyal customers. And in the meta-analysis by Harter, Schmidt and Hayes, employee engagement at business-unit level was related to customer satisfaction.
An honest caveat: correlation is not simple cause and effect. The relationship probably runs in both directions, because satisfied customers also make the work more pleasant. But that is exactly what makes it worth looking at both together.
Separate scores tell you how things are going. Together they more often tell you why. A few patterns that can become visible:
These patterns are illustrations, not fixed laws. What you see in your own organisation may be different. That is exactly why it pays to look.

You only see a relationship if you look at the same level: per team, branch or region. Two organisation-wide scores say little. Make sure customer feedback can be traced back to the team that helped the customer, and that you can put that same team’s employee feedback next to it. Protect employees’ anonymity: only show results for groups that are large enough.
Ask customers and employees about the same topics, each from their own perspective. Ask the customer how quickly they were helped. Ask the employee whether they have the resources and the room to help customers quickly.
Plan both measurements so that you can discuss them together. A customer survey from the spring and an employee survey from the autumn are hard to connect.
Bring HR and the people responsible for the customer to the same table. Even better: discuss the results with the teams themselves. They can often explain straight away why a pattern exists and what can be done about it.
Using customer scores to hold teams to account. If you put low customer satisfaction straight down to a team, you often miss the cause. It regularly lies outside the team: in systems, planning or policy. Use the combination to understand, not to judge.
Looking only at averages. An average customer score for a whole organisation hides exactly the differences you can learn from. Look at the spread between teams and branches.
Drawing conclusions too quickly. A relationship between two scores in one measurement is a clue, not proof. Discuss what you see with the teams and check whether the pattern returns in the next measurement.
Don’t turn the answers into a list that disappears into a drawer. Together, choose one improvement that helps both the work and the customer, agree who owns it and check at the next measurement whether customer and team notice the difference.
Customer satisfaction and employee satisfaction don’t have to stay in two reports. Together they tell a richer story: where the work chafes, where customers notice it and where a team makes the difference. That conversation starts with the people closest to the customer. They often already know what the customer is going to say.
Curious how we help organisations connect employee and customer experience? Take a look at deepler.io.

Stijn van der Vat
Founder / CEO
Stijn founded Deepler in 2021 together with three other change managers, driven by a shared conviction: organizations only truly change when employees are taken seriously. As CEO, he shapes Deepler’s strategic direction and builds lasting partnerships with clients and partners. Stijn is often the first point of contact for organizations looking to get more out of their employees' voices.